How to Measure Query Performance
Dec 26, 2023
7 mins read

Introduction
Many developers often struggle with measuring query performance and accurately assessing the impact of their changes on the queries they are working on. In this article, I aim to show the process and provide a comprehensive guide on how to measure and compare query performance. Understanding these techniques is crucial for ensuring that optimizations and modifications lead to the desired improvements in your SQL Server environment.
Problems with Measuring Time
A common approach developers take to measure query performance involves using various types of timers. Among C# developers, the Stopwatch class is very popular for this purpose. The typical pattern involves starting the timer, executing the measured query, stopping the timer, and then logging the elapsed time.
var timer = new Stopwatch();
timer.Start();

// here is a measured query

timer.Stop();

// logging measured result
However, relying solely on query execution time can be problematic. SQL query execution time is not a predictable value, particularly in busy production environments. For instance, a query that typically runs for 1 second might suddenly take 20 seconds on one execution but return to 1 second on subsequent runs. Alternatively, the initial execution of a query could be slower due to the need to read data pages from disk, with subsequent executions proving much faster. These variations can lead to inaccurate conclusions.
It’s important to note that all measurements should be conducted in the target environment. Running queries on development machines may give entirely different execution plans, resulting in various results and potentially leading to inaccurate conclusions.
While more advanced tools like BenchmarkDotNet exist, performing benchmarks directly on servers under heavy load isn’t always practical or advisable. This limitation becomes even more apparent when assessing the performance of long-running queries. Fortunately, there are alternative approaches that provide a more reliable assessment of query performance.
IO Reads
A more deterministic and insightful method to measure query performance in SQL Server involves examining the IO statistics, providing a clearer picture of the engine’s activity.
The simplest way to access IO statistics is by running a query in Management Studio and adding a command to gather statistics before executing the actual query:
set statistics io on

-- query

set statistics io off
Upon running the query, you can view the results in the Messages tab. The output will display information about the number of pages the SQL Server engine read during the query execution.
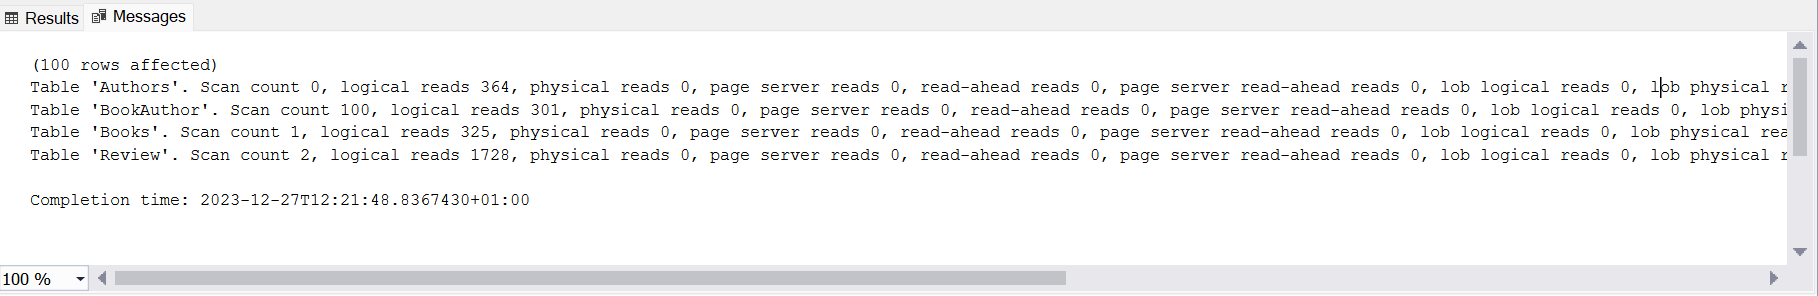
For a more organized presentation of these statistics, you can copy the generated data and use an excellent statistics parser by Richie Rump.
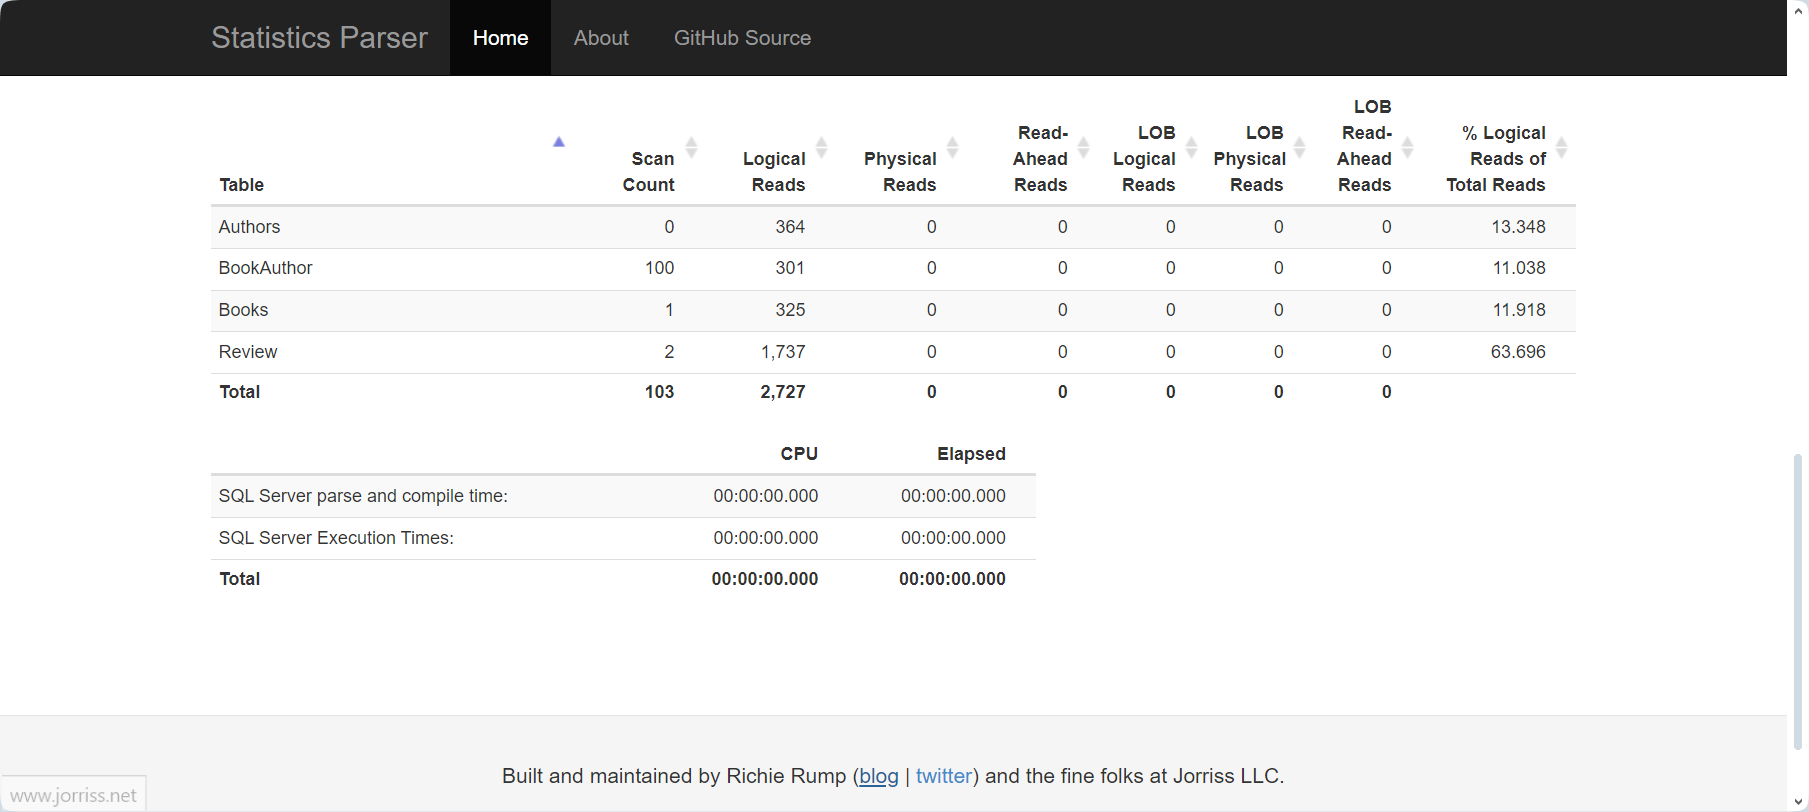
This approach yields much more consistent results and can be helpful with simple optimizations, as it shows a split of IO between different tables.
How to Read IO Statistics
The presented statistics not only provide a breakdown by tables but also contains various measures. To dig into these details, you can refer to the MSDN documentation.
For performance comparison, the most crucial metric is the number of logical reads. Basically, to assess how a query performs before and after changes, execute the query with SET STATISTICS IO ON both before and after modifications, and then compare the total number of logical reads. Logical reads offer a deterministic value, ensuring consistency regardless of server busyness with other queries. To put it simply, if you observe that your query reads 100 logical pages after changes compared to 1000 logical reads before (for the same set of parameters), it indicates that the query has become ten times more efficient after the changes.
However, exercise caution when comparing results between different servers. Not only can the number of pages differ if you’re not using the most recent database snapshot, but different SQL versions may result in distinct execution plans. While companies aims to maintain consistency across environments, especially between PreProd/Staging and Production, in practice, this alignment is not always guaranteed.
Problems
One common issue to be mindful of is related to the usage of User Defined Functions (UDFs), which may not accurately reflect all IO reads in the statistics returned by Management Studio.
To illustrate this issue, let’s run the following query on the StackOverflow database:
select
	top 100
		DisplayName,
		(select count(*) from Posts where OwnerUserId = u.Id) NumberOfPosts
from
	Users u
order by
	Id
If an index on Posts.OwnerUserId is missing, the query can be relatively slow, as indicated by the IO statistics:
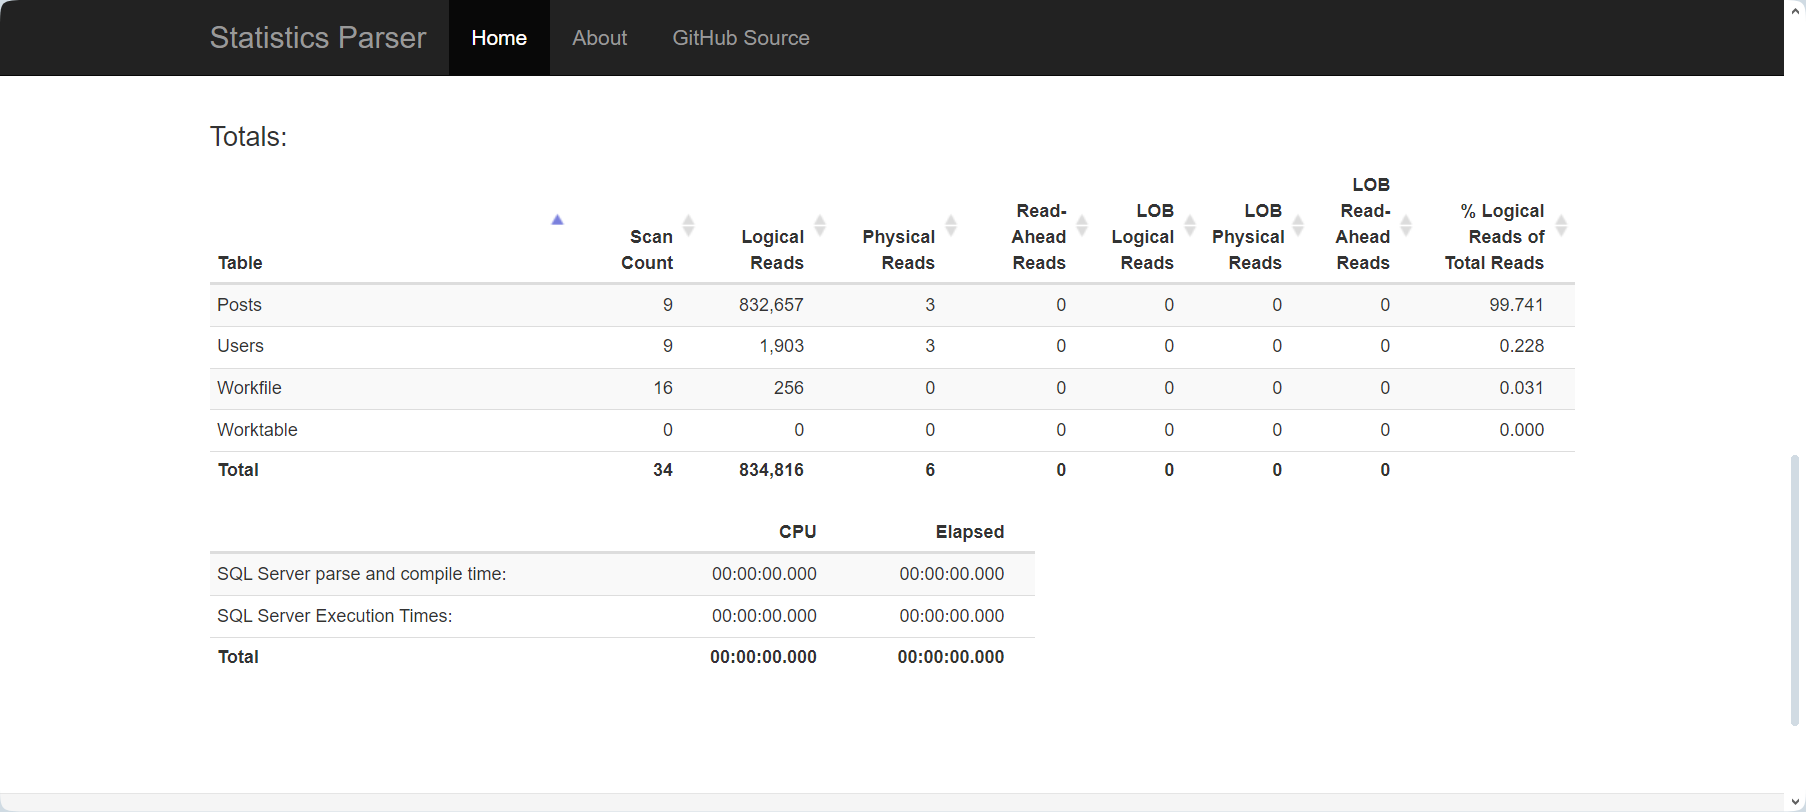
During testing, it’s worth noting that the statistics parser might encounter issues, potentially providing incorrect values for read-ahead reads.
Table 'Posts'. Scan count 9, logical reads 832657, physical reads 3, page server reads 0, read-ahead reads 830609, page server read-ahead reads 0, lob logical reads 0, lob physical reads 0, lob page server reads 0, lob read-ahead reads 0, lob page server read-ahead reads 0.
Running the query twice in a row shows substantial differences in execution time. The first execution:
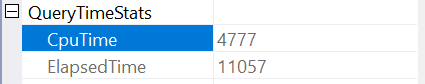
Versus the second:
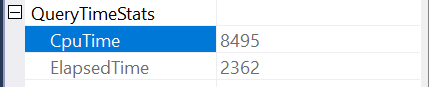
Difference is caused by a need of fetching data from disk. The lower elapsed time in the second execution is related to the fact that the data already residing in the memory buffer. In statistics you can see that there were no read-ahead reads for second execution:
Table 'Posts'. Scan count 9, logical reads 841314, physical reads 0, page server reads 0, read-ahead reads 0, page server read-ahead reads 0, lob logical reads 0, lob physical reads 0, lob page server reads 0, lob read-ahead reads 0, lob page server read-ahead reads 0.
In production, the contents of buffers are unpredictable, leading to significant variations in execution time for different query runs.
Now, let’s introduce a simple UDF:
CREATE FUNCTION [dbo].[GetNumberOfPosts] (@userId int)
RETURNS INT
AS
BEGIN

	DECLARE @numberOfPosts INT

	SELECT @numberOfPosts = COUNT(*)
	FROM [dbo].Posts
	WHERE OwnerUserId = @userId

	RETURN @numberOfPosts
END
Run the query with the new UDF:
select
	top 100
		DisplayName,
		[dbo].[GetNumberOfPosts](u.Id) NumberOfPosts
from
	[dbo].Users u
order by
	u.Id
Subsequent executions of this query are noticeably slower than the first query. However, Management Studio reports a surprisingly low number of reads:
Table 'Users'. Scan count 1, logical reads 28, physical reads 0, page server reads 0, read-ahead reads 0, page server read-ahead reads 0, lob logical reads 0, lob physical reads 0, lob page server reads 0, lob read-ahead reads 0, lob page server read-ahead reads 0.
To obtain accurate read counts when UDFs are in use, it’s necessary to inspect statistics using Profiler or Extended Events:

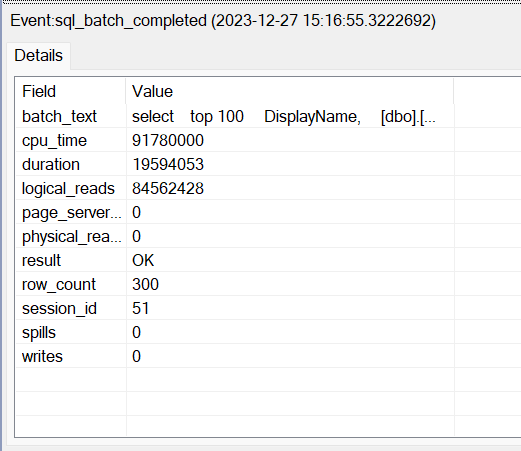
Configuring Profiler or Extended Events is beyond the scope of this article. However, it’s important to note that using UDFs is generally a bad practice. If they exist in your codebase, consider starting optimizations by removing them. Even in the provided example, the solution with UDF performs worse than the one without (840k vs. 84 million logical reads). Understanding that statistics from Management Studio may not be accurate for queries with UDFs is important in ensuring reliable performance assessments.
Summary
When optimizing query performance, leverage IO STATISTICS to compare results before and after your changes. Avoid relying solely on execution time, as accurately measuring it can be challenging. If your query involves User Defined Functions (UDFs), consider eliminating them as a primary optimization step. However, for precise results in this scenario, it’s essential to examine the number of reads using a Profiler/Extended Events session for accurate comparison of optimization results. Taking these steps will contribute to a more informed and reliable approach to query performance enhancements.
If you like this article, please share it via your social media: